
Could solar power the United States? It’s a familiar argument in the comments section of any energy news article, and it usually goes one of two ways: “solar can never generate enough power for a country this size,” or the mirror-image claim that a single solar farm the size of a small state could do the whole job. Both versions skip the math. Run the numbers honestly, using a real utility-scale PV project in the Arizona desert as the model, and the answer lands somewhere more interesting than either soundbite: yes, a single day of sunlight hitting a fraction of Arizona could generate more electricity than the entire country uses in a day, but that fraction is a genuinely large square of desert, and it only works if enough battery storage exists to actually let solar power the United States around the clock.
How Much Electricity Does the US Actually Use in a Day?
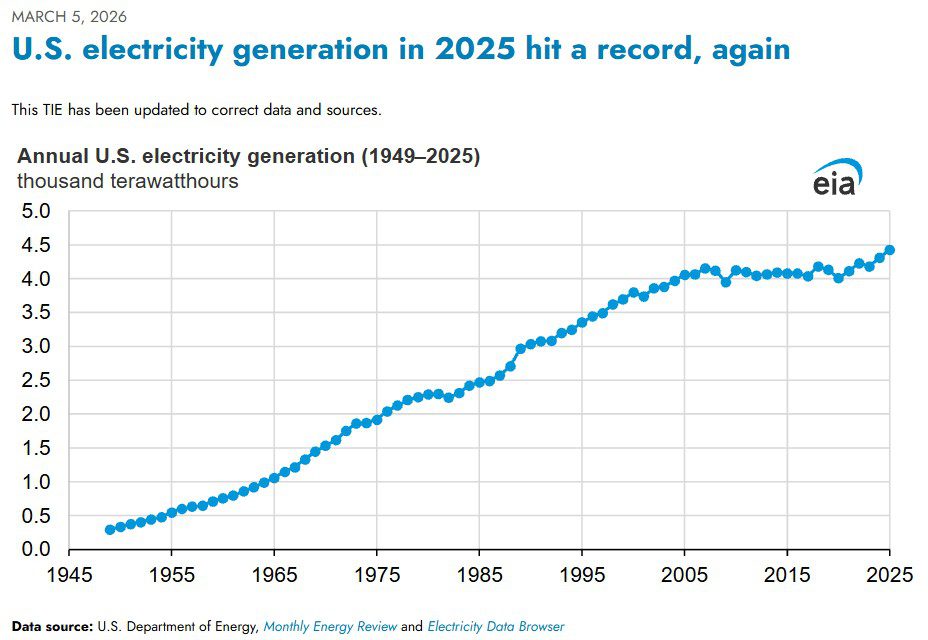
The U.S. Energy Information Administration reported in March 2026 that U.S. electricity net generation hit a record in 2025: 4.43 thousand terawatt hours, or 4.43 trillion kWh (4,430,000 GWh), for the year, up 2.8% from 2024. Divide that evenly across 365 days and the country used about 12,137 GWh (12,137,000 MWh) of electricity on an average day in 2025. That’s the daily energy total any serious plan to solar power the United States has to beat.
One caveat worth stating up front: this is electricity only. Total U.S. primary energy use, including transportation fuel, natural gas for heating and industrial process heat, is roughly three times larger. “Powering the U.S.” in the popular argument almost always means the electric grid, so that’s the target used here, clearly labeled rather than quietly swapped.
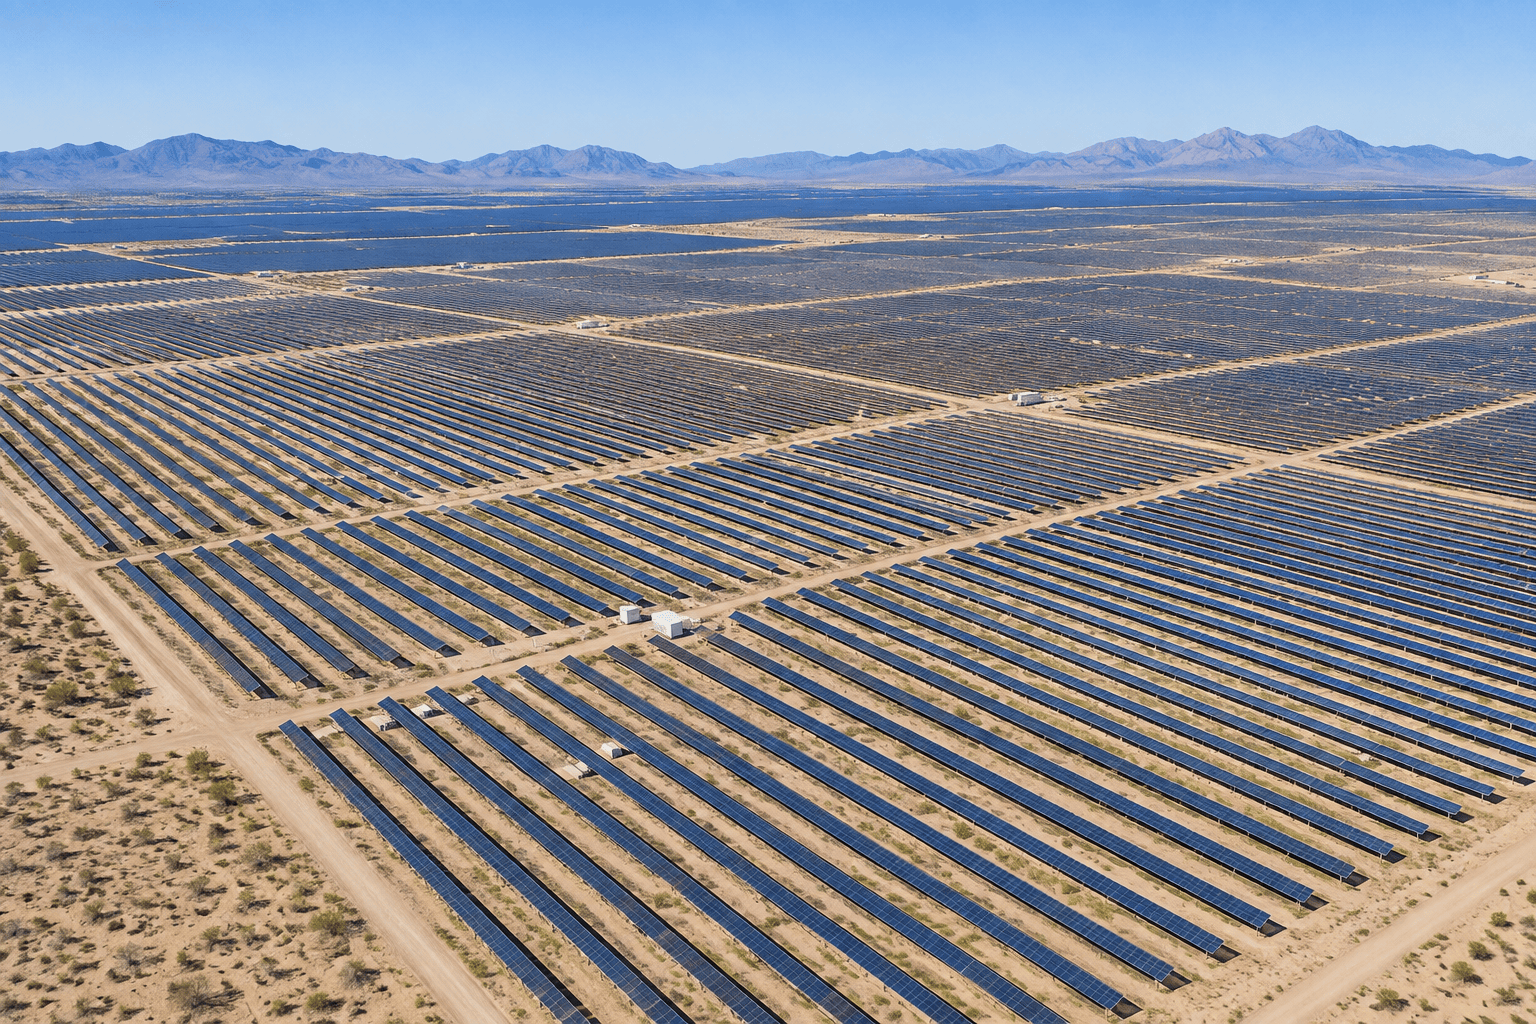
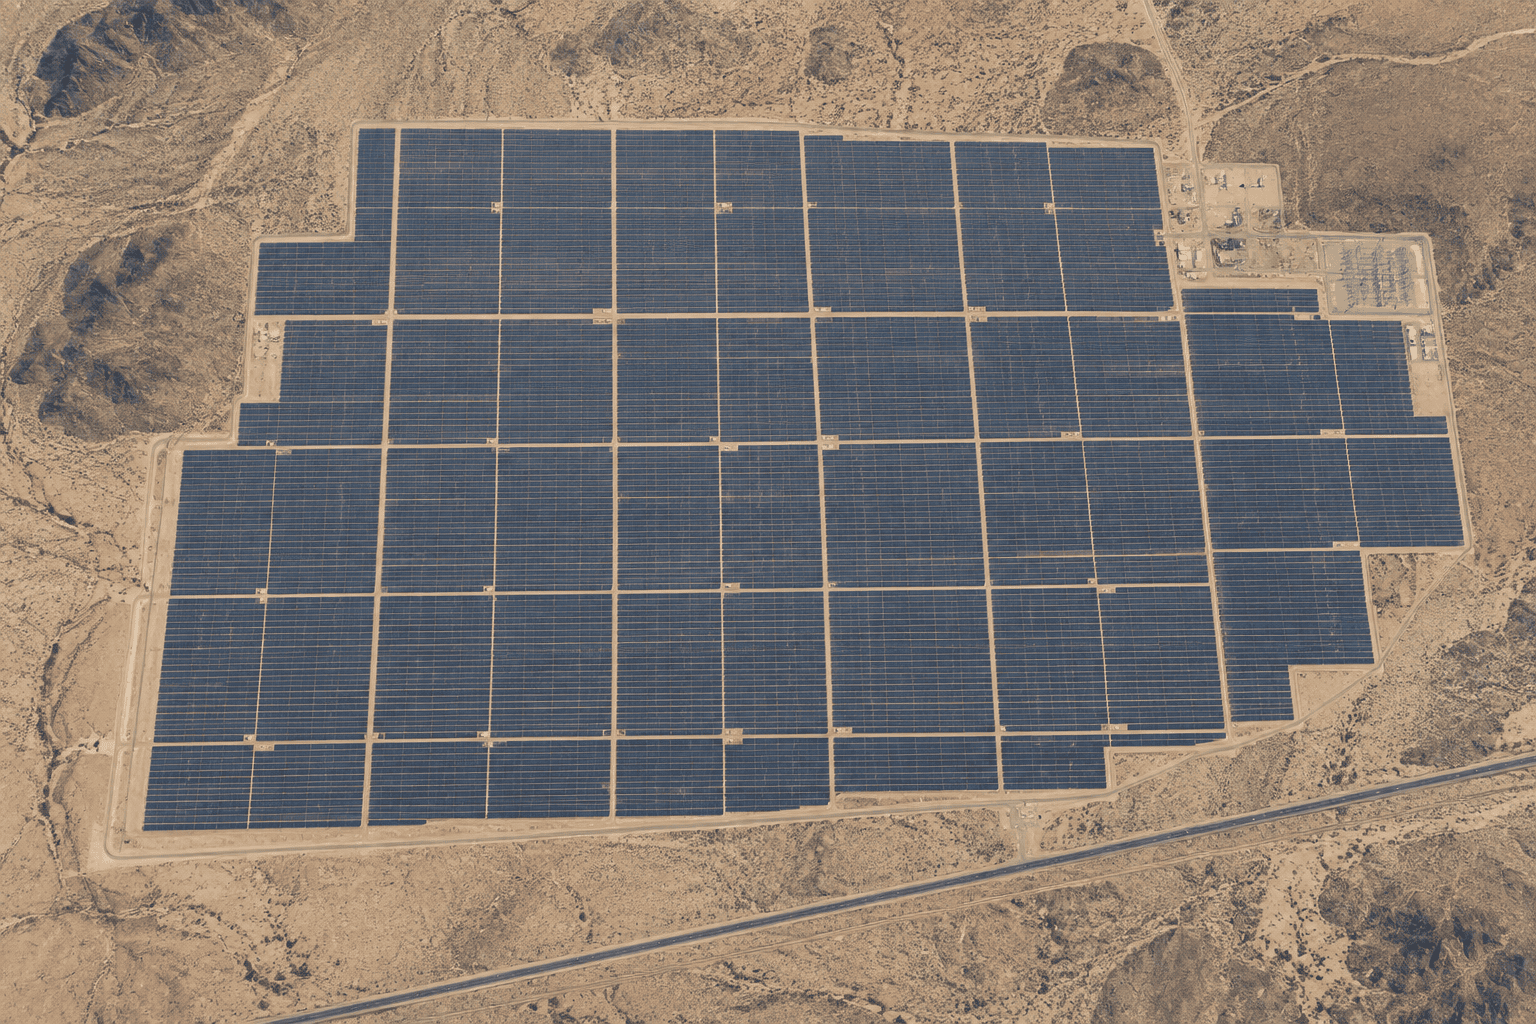
The Arizona Desert Thought Experiment: Could Solar Power the United States?
Arizona is a reasonable stand-in for “best-case U.S. solar resource”: high direct normal irradiance, low cloud cover, flat open land, and it already hosts several of the country’s largest utility-scale PV plants. Sizing an array that could actually solar power the United States starts with three standard solar-engineering inputs, not a capacity-factor guess: the site’s insolation, the array’s performance ratio, and the resulting specific yield.
Insolation (H): NREL’s National Solar Radiation Database puts annual average plane-of-array irradiance for a single-axis tracking system in south-central Arizona at roughly 7.5 kWh/m²/day, commonly expressed as “7.5 peak sun hours.”
Performance ratio (PR): PR is the ratio of the energy a system actually delivers to the energy it would deliver if every module always performed at its STC (Standard Test Conditions) rating with zero losses. It captures temperature derating, DC wiring and mismatch losses, inverter conversion losses, soiling and system availability. Well-run utility-scale trackers typically run a PR of 0.75-0.85; this analysis uses PR = 0.80 as a representative mid-range value.
Specific yield (Y): Specific yield, expressed in kWh of AC energy per kWp of DC nameplate capacity per day, is simply insolation multiplied by performance ratio:
Y = H × PR = 7.5 kWh/m²/day × 0.80 = 6.0 kWh/kWp/day
(For reference, that specific yield corresponds to an equivalent capacity factor of 6.0 ÷ 24 = 25%, in case a reader wants to cross-check it against a capacity-factor figure from another source.)
Sizing the Solar Array
Required DC nameplate capacity is simply daily energy demand divided by specific yield:
12,137,000,000 kWh ÷ 6.0 kWh/kWp/day = 2,022,831,050 kWp ≈ 2,023,000 MW ≈ 2,023 GW (DC)
Utility-scale trackers are typically built with an inverter loading ratio (ILR, or DC:AC ratio) of about 1.25, oversizing the DC field relative to inverter capacity to keep inverters closer to full output through more of the day. At an ILR of 1.25, that DC field corresponds to about 1,618,000 MW (1,618 GW) of AC (grid-facing) capacity.
For scale, total installed U.S. solar capacity today, across every rooftop and utility-scale project combined, is a bit under 200 GW per EIA generation-capacity data. This thought experiment is asking for roughly ten times that, built as one array, in one desert.
How Much Land Would It Take? Picture a Single Square
Whether solar power the United States is even a realistic idea hinges as much on land as on generation capacity. NREL’s land-use benchmarking for utility-scale solar (Ong et al., Land-Use Requirements for Solar Power Plants in the United States, NREL/TP-6A20-56290) reports a generation-weighted total-area figure of roughly 3.4 acres per GWh generated per year for larger, one-axis tracking PV plants, a metric tied directly to energy output rather than to a capacity rating and an assumed capacity factor. Applying it to the 4,430,000 GWh of annual generation this scenario needs to replace:
4,430,000 GWh/year × 3.4 acres/GWh/year = 15,062,000 acres ÷ 640 acres/sq mi ≈ 23,500 square miles
Put another way, that’s a single square patch of desert roughly 153 miles by 153 miles, edge to edge. For scale, a square that size would stretch from Phoenix nearly to the California and New Mexico borders in both directions, well past Tucson. It’s close in total area to the state of West Virginia (24,230 square miles), and a bit larger than the combined land area of Massachusetts, Connecticut, Rhode Island and Delaware. Inside Arizona, which covers about 113,990 square miles, that’s roughly 21% of the entire state.
So yes: it really is that much land. It’s not a rooftop, not a county, and not “somewhere in the Mojave you’d never notice.” It’s a chunk of the American Southwest bigger than several states put together. Whether that reads as “surprisingly small” or “surprisingly enormous” mostly depends on what number you had in your head walking in, but neither the “postage stamp” nor the “cover Texas” version people throw around online is close to right.
The Missing Piece: Energy Storage
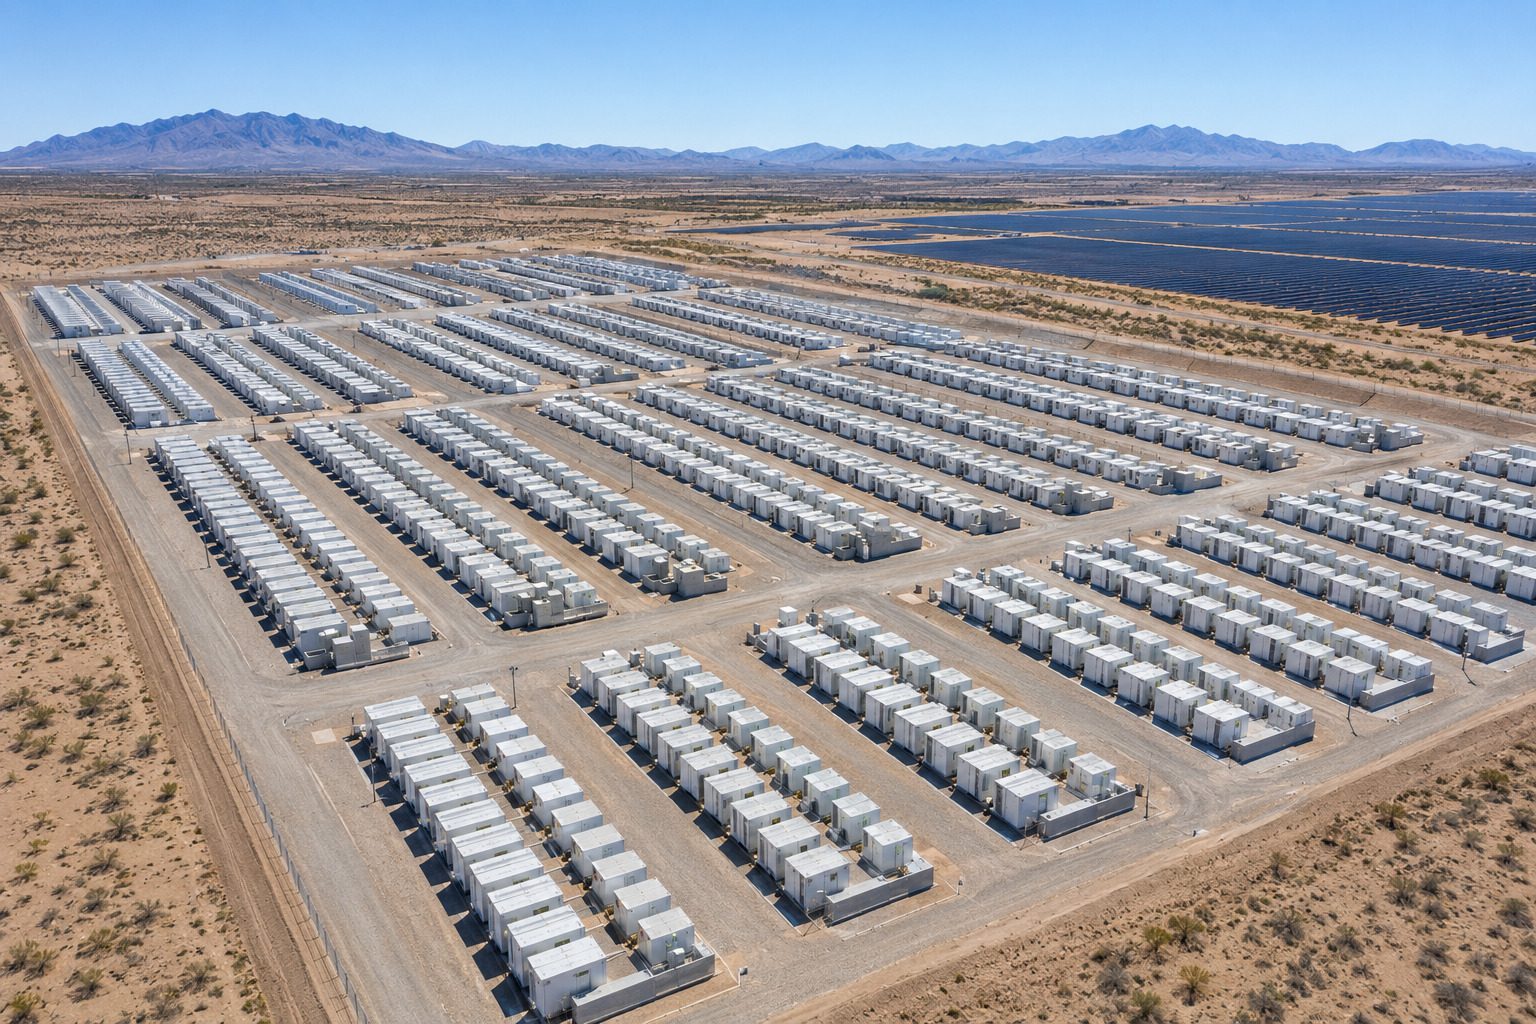
Here’s where the “solar can power America” claim usually quietly stops, and where it has to keep going to be honest. A 1,618 GW AC array only produces electricity while the sun is up. Average national demand of about 506 GWh per hour, meaning an average power draw of about 506,000 MW (12,137 GWh ÷ 24 hours), doesn’t pause at sunset.
Covering roughly 10 hours of night and morning ramp with battery storage, ignoring multi-day cloud cover and winter’s shorter days, which would push the real number meaningfully higher, requires a usable energy capacity of:
506 GWh/hour × 10 hours ≈ 5,060 GWh of usable storage, just to shift one day’s solar output into the hours when the sun isn’t shining.
Usable capacity isn’t the same as nameplate capacity. Utility-scale lithium iron phosphate (LFP) systems are typically operated at roughly 90% depth of discharge (DoD) to preserve cycle life, so the nameplate energy capacity that has to be purchased and installed is higher than the usable figure:
5,060 GWh ÷ 0.90 DoD ≈ 5,620 GWh nameplate (5,620,000 MWh)
For context, total utility-scale battery storage deployed across the entire United States today is on the order of 30-40 GWh nameplate. The single-site version of this thought experiment calls for well over 100 times that, and that’s before accounting for a run of overcast days or a stretch of Arizona’s summer monsoon season.
What Would It Cost?
PV System Costs
NREL’s Annual Technology Baseline puts 2024 utility-scale, one-axis tracking PV installed costs at roughly $0.83-$1.30 per watt DC. Using $1.00/Wdc as a round, defensible midpoint, applied against the 2,023,000 MW DC field sized above:
2,023,000 MW × $1,000,000/MW = $2.02 trillion for the PV array alone.
Battery Storage Costs
Utility-scale lithium-ion storage runs roughly $300/kWh installed for a standard 4-hour system per NREL ATB storage figures, applied here against the 5,620,000 MWh nameplate capacity sized above. Longer-duration systems, which is what this scenario actually needs, generally cost more per kWh than short-duration systems, so treat this as an optimistic floor, not a realistic ceiling:
5,620,000 MWh × $300,000/MWh ≈ $1.69 trillion.
Total Price Tag
PV plus storage lands around $3.71 trillion, or roughly 12% of 2025 U.S. GDP ($30.76 trillion, per the Bureau of Economic Analysis), spent in one place, on one project, before touching transmission upgrades to move 1,618,000 MW of AC capacity out of a single Arizona site to the rest of the country. That last part matters as much as the generation and storage numbers.
The Numbers at a Glance
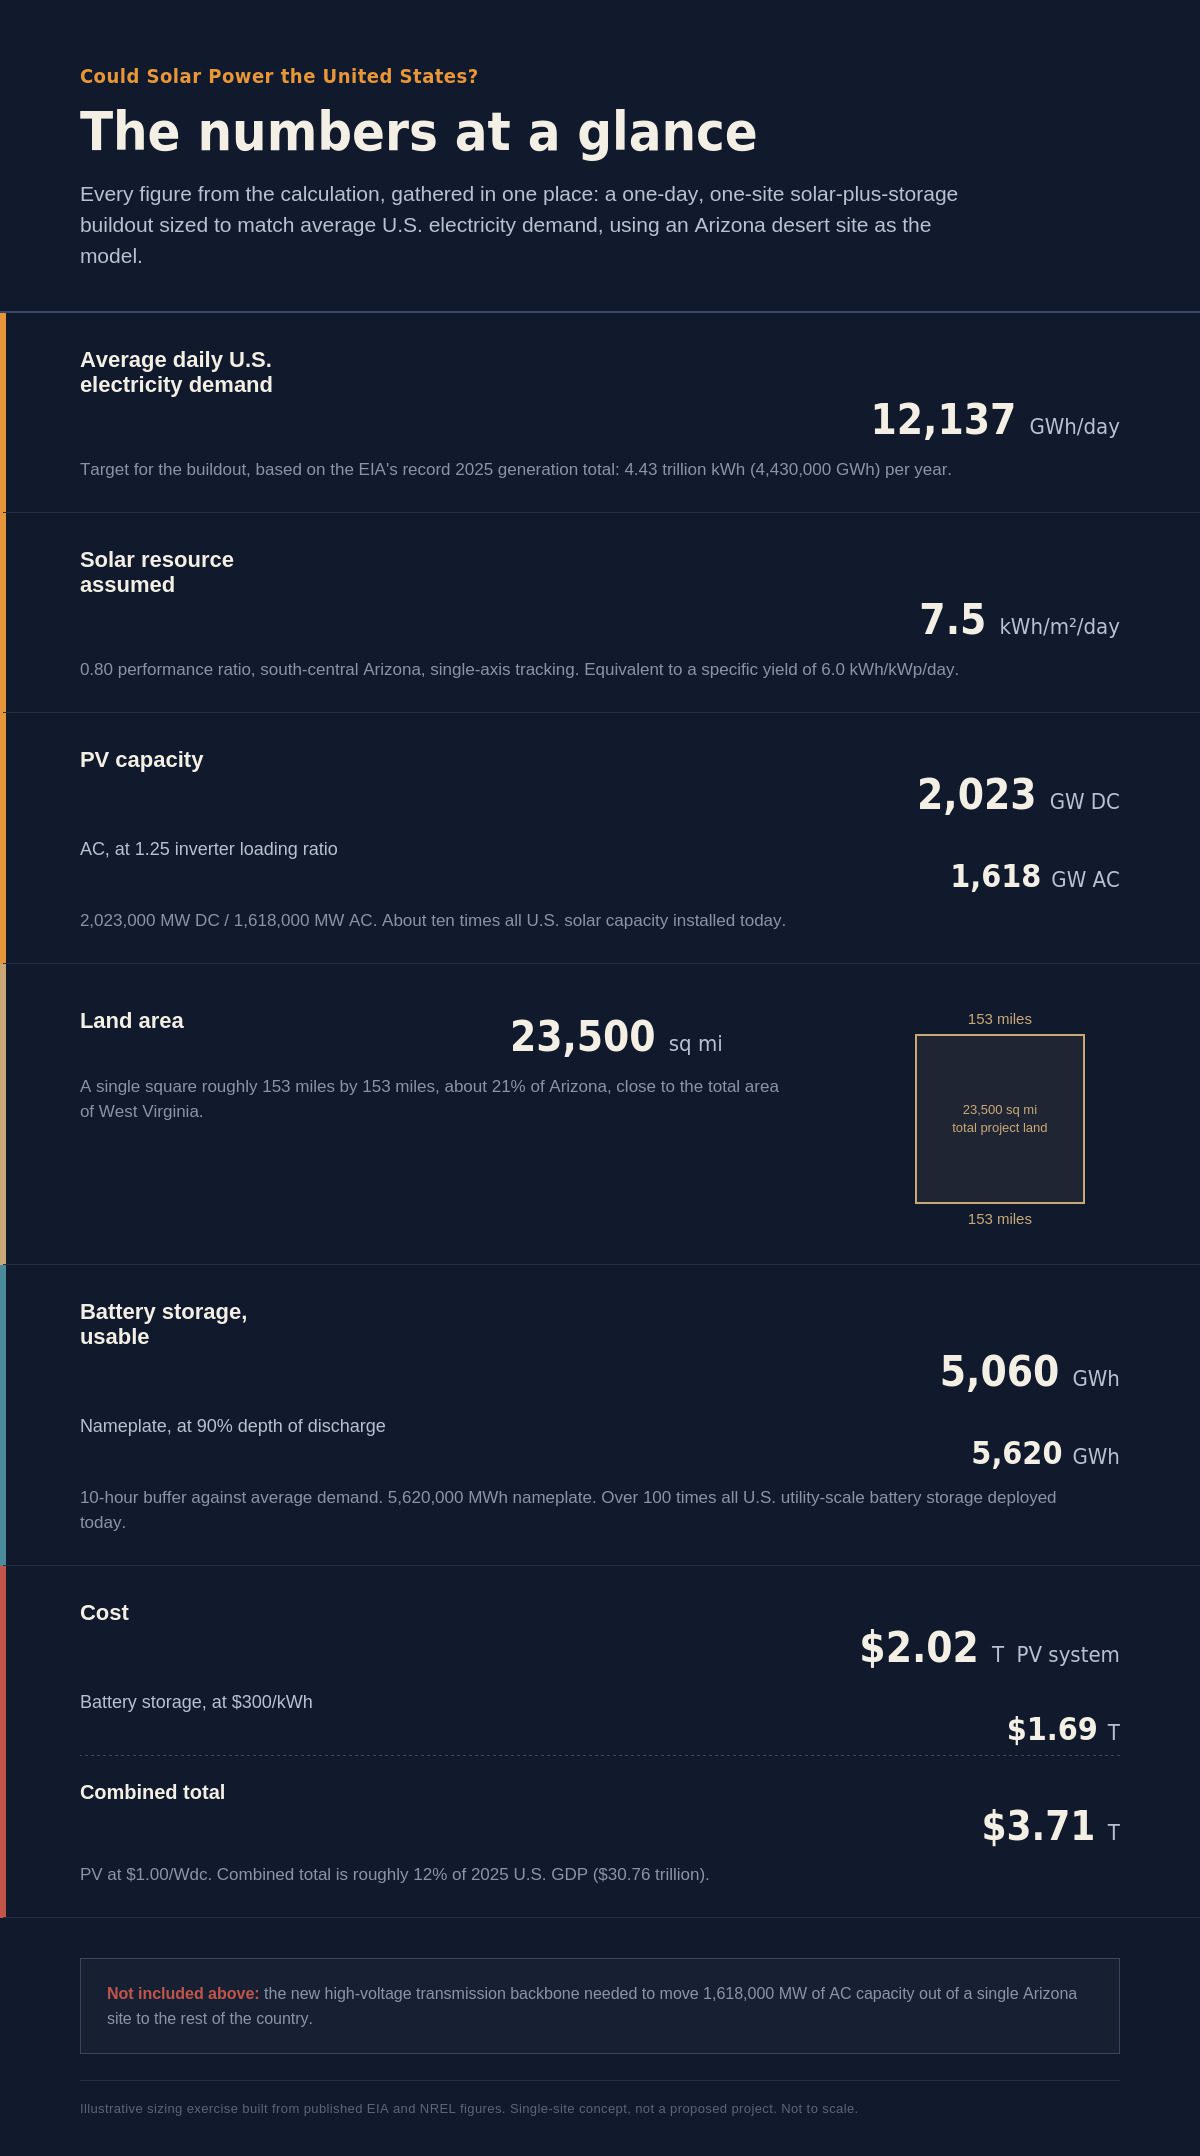
Every figure above, gathered in one place:
- Target: match average daily U.S. electricity demand, based on the EIA’s record 2025 generation total of 4.43 trillion kWh (4,430,000 GWh) per year, or about 12,137 GWh (12,137,000 MWh) per day
- Solar resource assumed: 7.5 kWh/m²/day insolation, 0.80 performance ratio, south-central Arizona, single-axis tracking
- PV capacity, DC: 2,023,000 MW (2,023 GW)
- PV capacity, AC (at 1.25 ILR): 1,618,000 MW (1,618 GW)
- Land area: approximately 23,500 square miles, roughly a single square 153 miles by 153 miles, about 21% of Arizona, close to the total area of West Virginia
- Battery storage, usable: 5,060 GWh (10-hour buffer against average demand)
- Battery storage, nameplate (at 90% DoD): 5,620 GWh (5,620,000 MWh)
- PV system cost (at $1.00/Wdc): $2.02 trillion
- Battery storage cost (at $300/kWh): $1.69 trillion
- Combined cost: $3.71 trillion, roughly 12% of 2025 U.S. GDP
- Not included in the above: the new high-voltage transmission backbone needed to move 1,618,000 MW out of a single Arizona site to the rest of the country
Why Nobody Is Actually Building This
The single-mega-site version of this exercise is a useful teaching tool, not a real project plan, for a few practical reasons:
- Transmission. Moving 1,618,000 MW of AC capacity from one Arizona site to the rest of the country would require an entirely new high-voltage backbone, at a cost that dwarfs the generation and storage numbers above.
- Weather correlation. A single-site array is exposed to a single weather system. A cloud bank over that one location knocks out the whole country’s generation at once; a distributed fleet averages that risk away.
- Grid stability. Concentrating this much generation behind one interconnection point creates a single point of failure a distributed grid architecture is specifically designed to avoid.
In practice, this capacity gets built the way it’s actually happening today: thousands of megawatt- to gigawatt-scale PV-plus-storage projects spread across the Sun Belt and beyond, each running its own commissioning and performance-testing process on the way to its own commercial operations date, tied together by transmission built incrementally rather than all at once. Battery systems at that scale still have to clear the same safety bar as a single mega-site would, including UL 9540A and UL 1973 certification, and Symtech Solar’s EPC team works through exactly that kind of PV-plus-storage closeout on real projects, at real, distributed scale.
Frequently Asked Questions
Could Solar Power the United States?
In terms of raw daily energy, yes: a square of utility-scale PV roughly 153 miles on each side, sited in a high-resource location like the Arizona desert, could generate more electricity than the U.S. used on an average day in 2025. The unresolved problem is storing and distributing that output, not producing it.
How many square miles of solar would it take to power the US?
Using an Arizona-grade insolation of about 7.5 kWh/m²/day and a performance ratio of 0.80, matching average daily U.S. electricity demand of about 12,137 GWh (based on the EIA’s record 4.43-trillion-kWh 2025 generation total) requires roughly 2,023,000 MW of installed DC PV capacity (about 1,618,000 MW AC). Applying NREL’s generation-based land-use intensity for utility-scale one-axis tracking PV (about 3.4 acres per GWh generated annually) works out to roughly 23,500 square miles of project land, or a square about 153 miles on a side, including access roads and setbacks, not panels alone.
Why not just build all U.S. solar in one place?
A single mega-site concentrates weather risk, requires an unprecedented new transmission backbone to move power nationwide, and creates a single point of failure. Distributing generation across many regional PV-plus-storage projects avoids all three problems and is how utility-scale solar is actually being deployed.
Final Thoughts
The honest answer to whether solar power the United States is a realistic idea is neither of the versions that show up in comment sections. The energy math checks out on a single sunny day in a favorable location, but “the math checks out” means a square of desert bigger than West Virginia, not a rounding error on a map. What doesn’t yet exist, anywhere, is the battery storage fleet needed to carry that energy through the night, and the transmission infrastructure to move it from one desert to three hundred million people. Both are being built, project by project, which is a far less dramatic story than a single Arizona-sized solar farm, but it’s the one actually happening.
Disclaimer: This article is an illustrative engineering thought experiment, not a feasibility study or a proposed project. All figures are order-of-magnitude estimates built from publicly available EIA and NREL data using simplified, stated assumptions, including a single insolation value, a single performance ratio, a single land-use intensity factor, and round-number costs for PV and battery storage. Actual project economics, land requirements and interconnection costs vary significantly by site, technology vendor, contract terms and market conditions, and would require a full engineering and financial analysis to determine. Nothing in this article should be read as investment, engineering or siting advice, or as a proposal for any specific location.